
OUR MISSION
Fourth Street Clinic helps individuals experiencing homelessness improve their health and quality of life by providing high-quality integrated health care.
For many Utahns experiencing homelessness, Fourth Street Clinic is their first and only chance at a diagnosis and ongoing treatment. By increasing access to primary care, Fourth Street Clinic is a major partner in ending homelessness, promoting community health, and achieving across-the-board health care savings.


Join us For
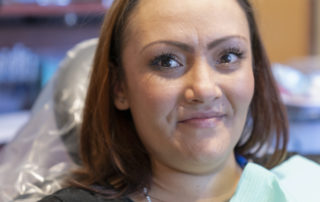
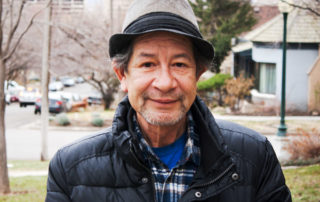
STORIES FROM THE STREET


THE FOURTH STREET CLINIC REPORT | NEWS
A Missed Opportunity: Why Access to Healthcare Still Matters
Fourth Street Clinic is encouraged to see a reported 1.6% decrease in homelessness reflected by the 2026 Point-in-Time (PIT) Count. Although modest, this progress [...]
The Salt Lake Tribune Voices: Housing Alone Does not Solve Homelessness
By Michelle C. Flynn, Janida Emerson and Kevin Curtis | For The Salt Lake Tribune | May 21, 2026, 6:05 a.m. On a [...]
Healing Without Barriers
Mental health challenges, substance use disorder and homelessness are often deeply connected – and deeply misunderstood. Stigma, past trauma, and broken trust can make [...]
How Homelessness Worsens Health, Especially for Minorities
April is Minority Health and Stress Awareness Month and from 4/6 - 4/12, it is also Public Health Week! Public Health Week highlights the [...]